TL;DR

Prime made for students and young adults
- Fast, free delivery for dorm and study essentials
- Prime Video and Amazon Music included
- Member-only deals
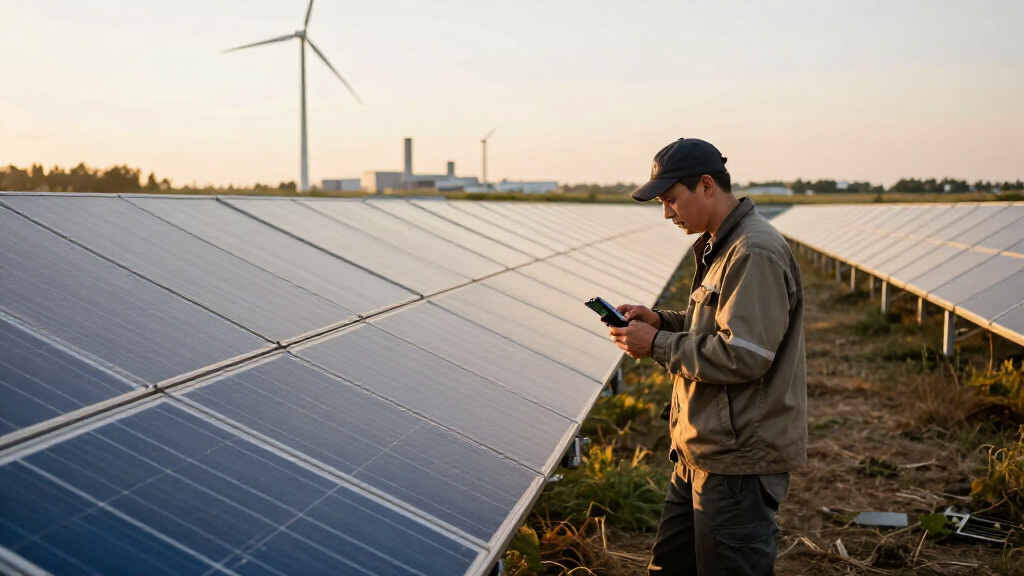
The World Nuclear Industry Status Report 2026 says global solar generation exceeded nuclear generation for the first time in 2025. Solar and wind each outgenerated nuclear in every month from March 2025 through June 2026, while the report records fast growth in renewable capacity and slower expansion in nuclear power.
Solar power generated more electricity than nuclear power worldwide in 2025 for the first time, according to the World Nuclear Industry Status Report (WNISR) 2026. The report also says that either solar or wind individually produced more electricity than nuclear in every month from March 2025 through June 2026, marking a shift in the balance between the fast-growing renewables and the comparatively slow-growing nuclear fleet.
The report, overseen by French nuclear energy consultant Mycle Schneider, puts global nuclear generation at 2,703 terawatt-hours in 2025, up 1.1% from the year before. Solar generation rose 30%, the report says, overtaking nuclear’s annual total. Nuclear output increased mainly because of a 7.6% rise in China; outside China, generation declined by 0.2%.
The monthly milestone came in stages: wind generation surpassed nuclear in March 2025, followed by solar in April. From March 2025 to June 2026, one or both technologies exceeded nuclear output each month. In March, April and May 2026, solar and wind each separately generated more electricity than nuclear, according to the report.
Capacity figures show a similar contrast. WNISR says solar capacity grew by 510 gigawatts to 2,383 GW in 2025, while wind added a record 159 GW, reaching 1,291 GW. Installed nuclear capacity rose by 1.5 GW to 399.5 GW, though operating nuclear capacity fell by 0.5 GW to 368.6 GW. These are capacity measures, not electricity generated; the report’s generation figures describe power produced over time.
Renewables Pull Further Ahead
The finding matters because it records a change in annual global electricity generation, not simply the number of new projects or installed capacity. Solar’s annual output moving ahead of nuclear reflects the pace at which solar facilities have been added and brought into service. The report says the nuclear share of global electricity generation fell to 8.8% in 2025, its lowest level in 45 years and about half its 1996 peak of 17.5%.
That shift has implications for power systems and investment decisions. Solar and wind output varies with weather and time of day, so their expansion increases the value of storage and grid flexibility. WNISR reports that 104 GW and 257 gigawatt-hours of grid-scale batteries were connected in 2025; more than 78% of cumulative battery storage capacity had been installed between 2023 and 2025. The figures do not establish that batteries alone can resolve grid challenges, but they show storage deployment growing alongside renewables.
The comparison also informs debates about how quickly different power sources can scale. Nuclear remains a substantial source of electricity, but the report’s figures show much slower recent capacity growth than solar and wind. The generation milestone does not mean nuclear plants have stopped operating or that renewables have replaced them in every country.
As an affiliate, we earn on qualifying purchases.
A Long-Running Capacity Gap
WNISR describes nuclear capacity as essentially flat for more than 25 years, while solar and wind expanded quickly. In 2025, four reactors began supplying electricity and seven closed, the first negative annual reactor balance since 2021. As of July 1, 2026, the report counted 411 operating reactors in 31 countries, excluding 30 units in long-term outage.
New nuclear construction is concentrated in a small number of countries. The report counted 73 reactors under construction as of July 1, 2026, the highest total since 1987; China accounted for 37. It also says construction delays remain common: none of the 16 reactors connected to the grid from 2023 through 2025 finished on schedule, and their average construction period was 10.9 years.
The solar capacity comparison may be understated. WNISR used an estimate of 510 GW of global solar additions in 2025. The source report notes that more recent figures from IEA PVPS put additions at around 690 GW, about 180 GW higher. The two figures come from different data sources, so the higher estimate should not be treated as a revision made by WNISR itself.
“The reality of the nuclear industry on the ground is quite sobering for those who expected to find a booming sector.”
— Mycle Schneider, overseer of WNISR 2026, speaking to pv magazine
As an affiliate, we earn on qualifying purchases.
Data Sources and Comparisons
The milestone is based on WNISR’s accounting of global generation, but the source material does not provide a detailed methodology or a country-by-country breakdown for the solar-versus-nuclear annual comparison. The report’s solar capacity estimate also differs from the higher 2025 additions figure attributed to IEA PVPS; the precise effect of that difference on the capacity gap depends on which dataset is used.
Monthly comparisons through June 2026 show a sustained period in which solar or wind exceeded nuclear, but the supplied report summary does not give the exact monthly generation values. It also does not establish how future output will change as new plants enter service, existing reactors close, or renewable generation and storage expand. The long-term balance remains dependent on deployment, operating performance and electricity demand.
As an affiliate, we earn on qualifying purchases.
Tracking Generation and Grid Growth
The next useful comparison will be full-year generation data for 2026, which can show whether solar remains ahead of nuclear over a second annual period. Monthly figures after June will also indicate whether the pattern reported by WNISR continued through the rest of the year.
Further updates to solar installation estimates may narrow or widen the difference between datasets. Readers can also expect attention to new nuclear construction, reactor closures and grid-scale storage, all of which affect how much electricity each source supplies. The report’s current figures describe a milestone already reached in 2025, while the duration and scale of the shift remain developing.
solar energy generator for camping
As an affiliate, we earn on qualifying purchases.
As an affiliate, we earn on qualifying purchases.
Key Questions
Did solar surpass nuclear in installed capacity or electricity generation?
The reported milestone concerns electricity generation: WNISR says solar produced more electricity globally than nuclear in 2025. The report also compares installed capacity separately, but capacity and generation are different measures.
When did solar first exceed nuclear generation?
WNISR says solar first exceeded nuclear on a monthly basis in April 2025. Wind had passed nuclear in March. Solar then surpassed nuclear for the full year of 2025, according to the report.
Did solar and wind both exceed nuclear every month?
Not throughout the entire reported period. From March 2025 through June 2026, either solar or wind individually generated more electricity than nuclear each month. Both sources individually exceeded nuclear in March, April and May 2026.
How fast did nuclear generation grow in 2025?
Global nuclear generation rose 1.1% in 2025 to 2,703 terawatt-hours, according to WNISR. The report attributes most of the increase to China; nuclear output outside China fell 0.2%.
Why do the solar capacity figures differ?
WNISR counted 510 GW of solar additions in 2025, while the source report cites IEA PVPS data indicating around 690 GW. The figures come from different sources and estimates; the supplied material does not provide enough detail to reconcile their methods.
Source: hn
Halloween Picks
halloween
As an affiliate, we earn on qualifying purchases.